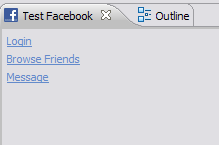
Since we have a plug-in available to exercise the Facebook API (see Part 1), the next step is to create a ‘org.eclipse.facebook.ui’ plug-in that will exercise that API. What I generally do when testing some new code in Eclipse is to create a simple view. In this case, I’ll create a stub view with a hyperlink to launch some Facebook login wizard (along with some other test hyperlinks):
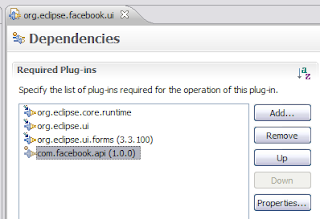
Now that I have the basic code infrastructure in place, let’s get our Web 2.0 on by using that Facebook API! In Eclipse land, to take advantage of another plug-ins’ classes, you need to express a dependency on it. So in order for me to use the Facebook API plug-in I created in Part 1, we need to depend on it. We can do this in the plug-in manifest editor by going to the dependencies page and adding a dependency for the ‘com.facebook.api’ plug-in:
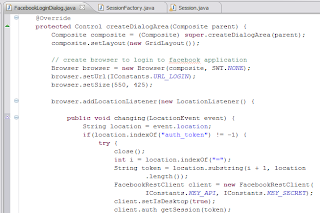
After reading the Facebook API in detail… it seems the API for logging in is straightforward albeit a bit tricky for a deskop-based application. In essence, you have to point to a special URL given to you by Facebook to login… once a user logs in, you need to capture a token that you use to create a REST client for Facebook API access. Ok, translating this into Eclipse terms, I figure all I need is a popup dialog and an SWT Browser widget with a clever listener. So here it is:
All this code does is create an embedded browser within a popup dialog and fishes for a particular authentication token from Facebook. If it finds the particular token, it will create a session with Facebook, if not, it will keep the dialog open until the user properly authenticates.
I was initially having trouble logging in to the service because I was stupid in how I was parsing the authentication token. I didn’t solve the problem until I enabled some tracing information. One interesting way to allow tracing for your Eclipse-based applications is to use the Platform debug facilities.
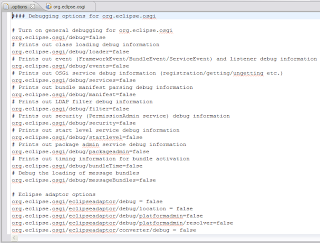
The basic gist is to create a .options file in the root of your plug-in. Here is how the ‘org.eclipse.osgi’ plug-in .options file looks like:
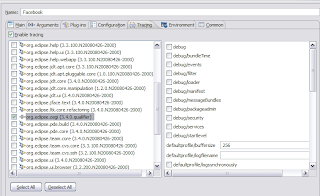
Pretty simple right…? Now, when you go to launch Eclipse applications, there is a tracing tab that allows you to tweak this options on and off to see what type of tracing information you would like:
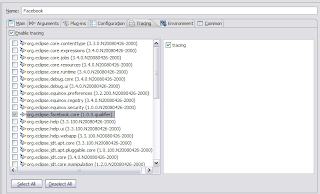
I basically enabled this tracing ability within the facebook plug-in:
I then peaked at the console after I logged into see some tracing output:
So there, now I have a simple little framework to enable configurable tracing within my Eclipse-based applications.
That’s it for Part 2. In Part 3, we will cover things like separating core code from user interface code, Eclipse Forms and amongst whatever else pops up in my head.
Lessons Learned
- Start simple and iterate as you make progress
- A simple view provides a good way to test code
- Trace early, trace often
- Platform debug tracing provides a simple way to enable configurable development time debugging
Thanks for listening.


